Diagnostic Tools
Command Line Interface (CLI)
The SD WAN Portal has a command line interface window that allows specific commands to be executed on each of the WAN and LAN interfaces that have been configured. The WAN and LAN have different options available as follows:
-
WAN:
-
Ping
-
Traceroute
-
Show TX/RX
-
ARP
-
-
LAN:
-
As above for the WAN interface
-
Show all roots
-
Show static routes
-
OSPF
-
BGP
-
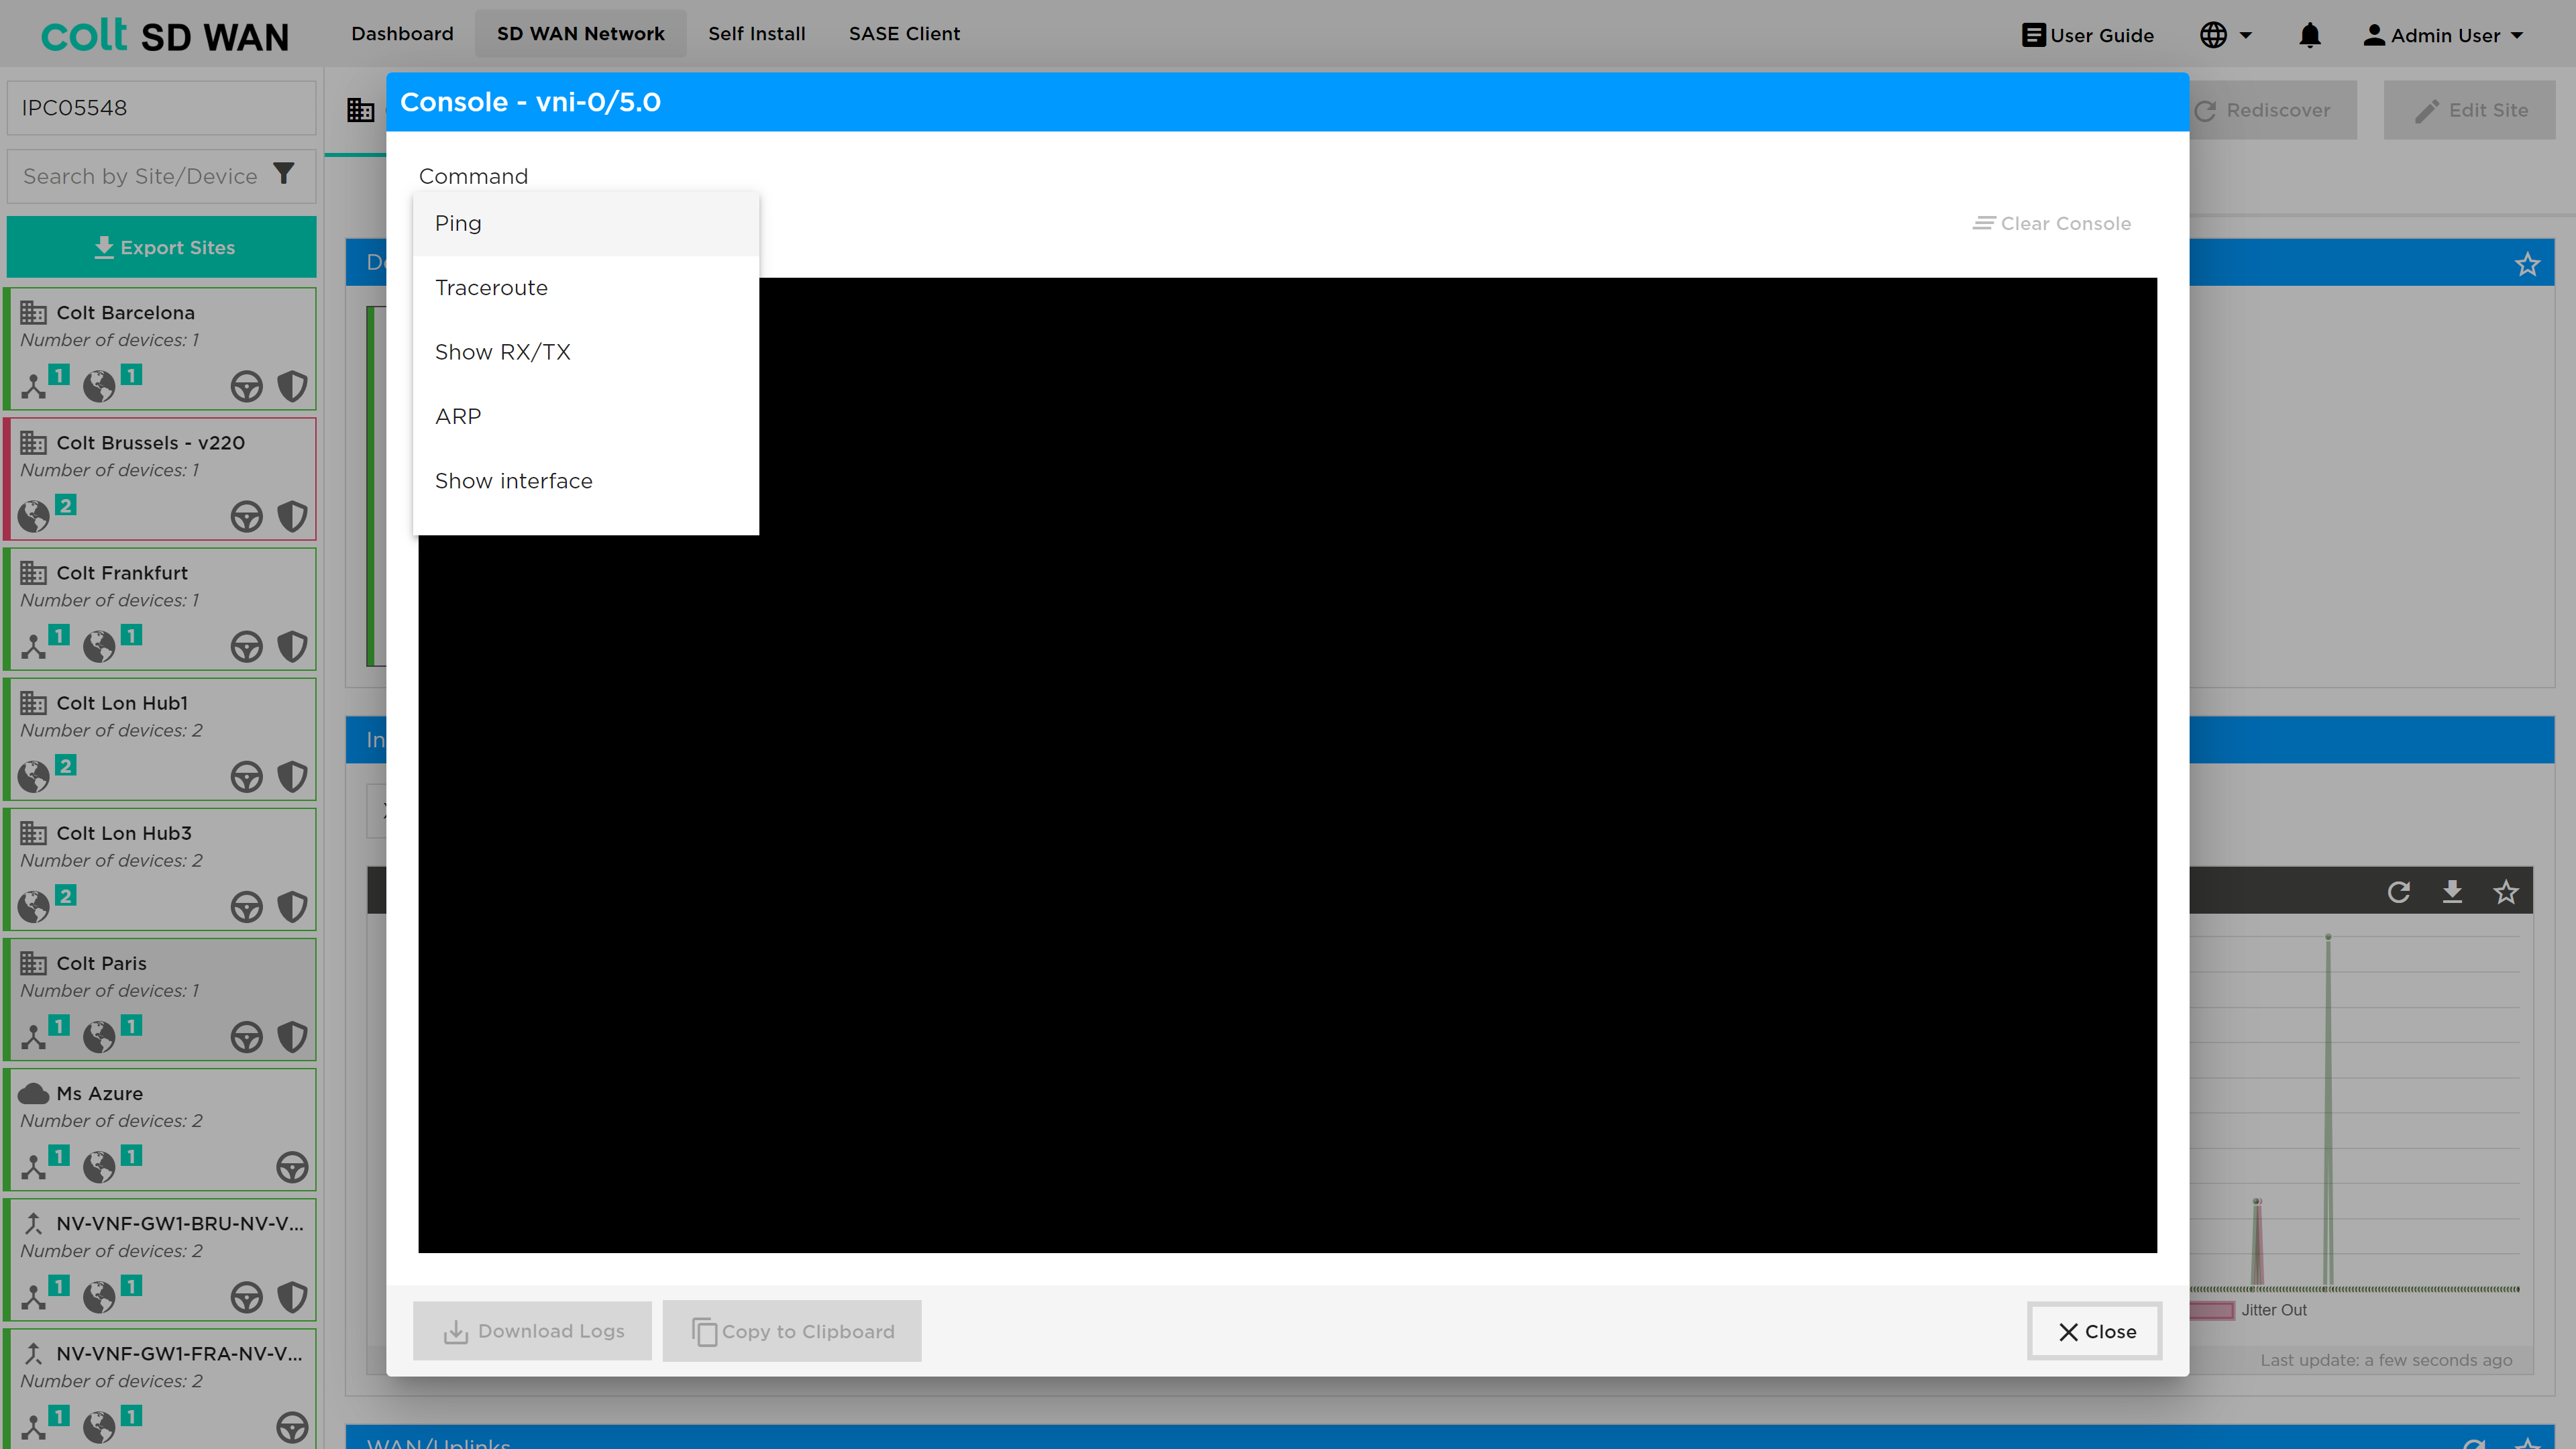
The command console is selected using the console icon as shown below.
The result is a list of command prompts that can be selected and each will generate specific additional menu options. Once the command has been executed the results are displayed in the console window.
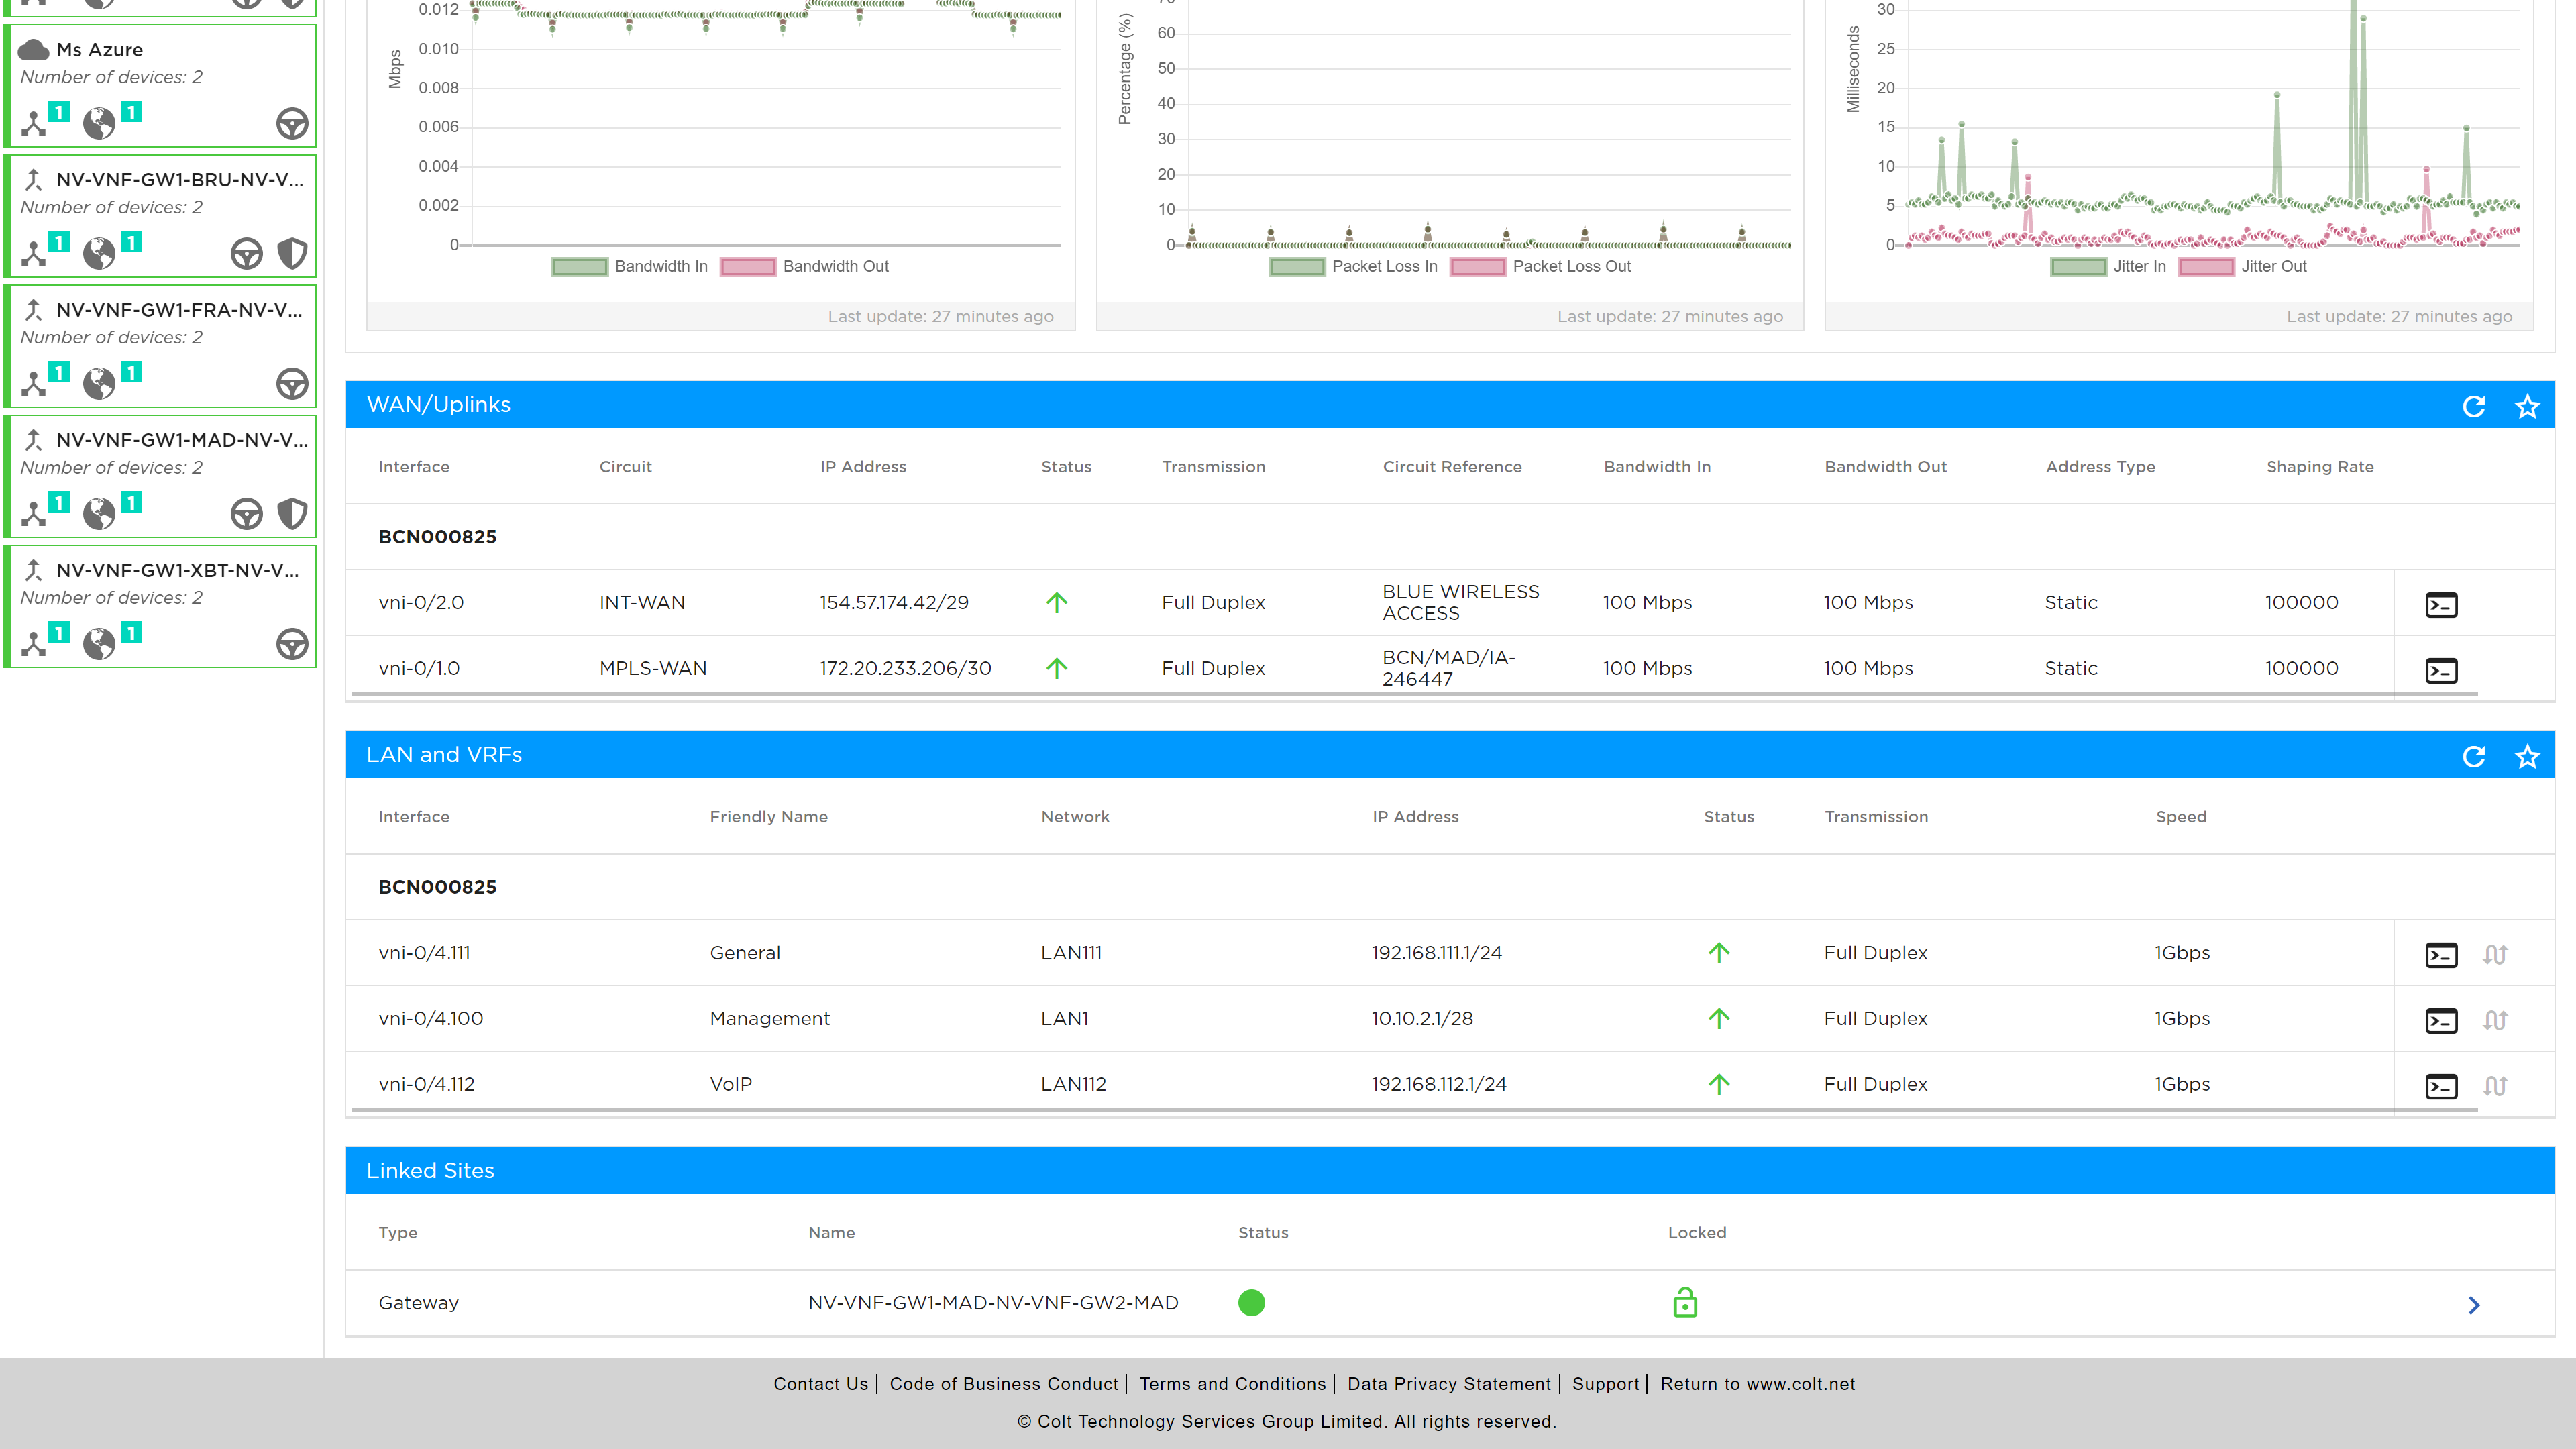
In addition to the above tools, the IP QoS commands are available, see screen shot below.

The QoS Brief shows a snap shot of the interface throughput, QoS Detail shows the snapshot by traffic class, QoS Extensive shows the throughput by class, queue and drop. The QoS Summary shows a snapshot of the total through put by traffic class and queue.